Profiling aarch64 in the Cloud: Sampling Skid, SPE, and the State of Arm Tooling
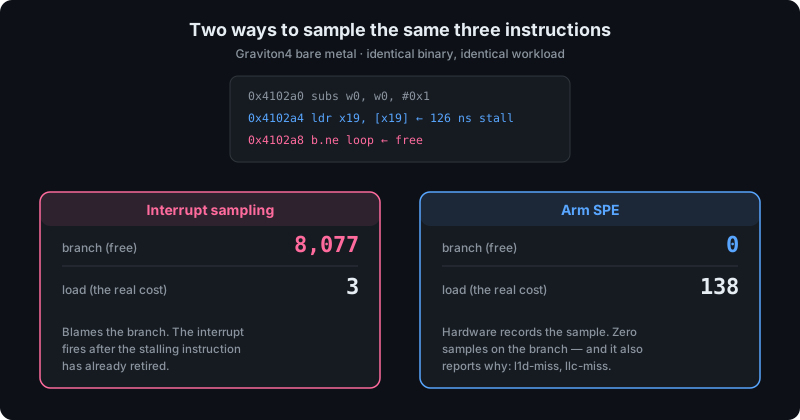
Almost every profiler ever written shares a blind spot, and almost nobody using one knows it’s there. Sampling-based profilers can attribute the cost of a slow instruction to a completely different instruction nearby, quietly, without any indication that it happened.
I went looking for that blind spot on AWS Graviton using a test program where I already knew the correct answer. Arm Performix did two things I hadn’t expected. It showed me the blind spot clearly, and then it gave me the hardware feature that removes it, on the same machine, in the same session.
Performix is Arm’s performance analysis toolkit for Neoverse. It’s free, it launched in April 2026, and it targets Graviton, Cobalt, Axion and Arm’s own AGI CPU. I spent about $9.55 putting it through six instances across AWS and Google Cloud, from a 2-vCPU burstable up to 96-core bare metal.
If you already know what sampling skid is, skip the next section.
What a profiler is actually doing
A modern CPU core runs several instructions per clock cycle, at several billion cycles per second. You can’t record what it’s doing at every moment, because the recording would cost more than the work being recorded.
So profilers take samples instead. A few thousand times a second, the processor is interrupted, a note is made of which instruction it happened to be running, and it carries on. Do that for ten seconds and the instruction that shows up most often in your notes is, statistically, where the time went.
It’s a bit like photographing a factory floor at random moments to work out which machine is holding up production. You never watch the whole shift. You just take enough photographs that the busy machine shows up in most of them.
The two instructions in question
The inner loop of my test program is three instructions, repeated billions of times:
subs w0, w0, #0x1 decrement a counterldr x19, [x19] load: fetch the next address from memoryb.ne loop branch: jump back to the topA load fetches data from memory. If the data is already sitting in the CPU’s cache, that takes a nanosecond or two. If it isn’t, the core has to fetch it from main memory (DRAM) and wait around a hundred nanoseconds doing nothing useful. In CPU terms that’s an eternity: several hundred wasted cycles.
A branch jumps somewhere else in the code. In a tight loop the processor predicts it correctly every single time, so it costs essentially nothing.
I wrote the loop so that each load fetches the address of the next load. That deliberately defeats the prefetcher, the hardware that normally guesses what you’ll need next and fetches it early. With prefetching defeated, every load has to go all the way to DRAM and wait.
The result is 126 nanoseconds per iteration, and near enough all of it is that one load instruction. The counter and the branch are free.
That was the entire point of building it this way: I knew the correct answer before I ran any tool. If a profiler tells me anything other than “your load is the problem”, the profiler is wrong.
What interrupt sampling reports
Interrupt-based sampling, the technique perf and most other profilers use, put 8,077 samples on the branch and 3 on the load. It credits the free instruction and almost entirely misses the expensive one.
This is not a Performix behaviour. It’s what the technique does on any architecture, and it’s what you would see from any standard profiling tool on this loop.
Why that happens
When a sample is triggered, the CPU raises an interrupt. But the core doesn’t stop dead. By the time the interrupt handler writes down where it was, several more instructions have gone past, and the slow load has already finished and retired. What gets recorded is whatever happened to be executing a moment later.
Back to the factory: the camera has a shutter delay. You press the button the instant machine A jams, and the photograph comes out showing machine B.
This is called skid, and the important part is that it’s systematic rather than random. The delay is roughly constant, so the error leans the same way every time. Taking more photographs doesn’t help, because they’re all late by the same amount. I measured it on two different chip generations at two different sampling rates and got the same answer, which is what makes it a property of the technique rather than a quirk of one processor.
If you optimised your code based on that profile, you’d rewrite the loop condition, which costs nothing, and never touch the memory access pattern, which costs everything.
What SPE does differently
Arm’s Statistical Profiling Extension, available since the Neoverse N1 generation, moves the recording into the hardware. Rather than interrupting the core and asking where it is, the CPU writes the sample record itself, at the moment the operation happens, including how long that operation actually waited and which level of cache or memory served it.
No shutter delay. On the same machine, against the same binary, SPE put zero samples on the branch and 138 on the load. Not fewer on the branch. None.
That is the thing worth taking away. A limitation that has quietly distorted profiling data for three decades is fixed in Arm silicon, and Performix is how you get at it without writing your own SPE decoder.
The rest of this post works outward from that result. First the hardware that makes it possible, then the measurements in full, then what each hyperscaler actually exposes, then the tooling, Arm’s own and everyone else’s, and finally what’s still broken.
The hardware foundation: Arm’s performance monitoring unit
Everything else here sits on PMUv3, the Performance Monitoring Unit version 3, which every modern aarch64 core implements. Where x86 reaches its PMU through model-specific registers, PMUv3 lives entirely in aarch64 system registers: PMCR_EL0 to control it, PMEVCNTR<n>_EL0 for the counts, PMEVTYPER<n>_EL0 to choose events, PMCCNTR_EL0 for cycles. Basic counting needs no memory-mapped I/O at all.
Architecturally Arm has the better end of this. PMUv3 allows up to 31 programmable counters against x86’s usual 4 to 8, though implementations typically expose 6, and the counter wall further down is about what happens to those 6 in a cloud VM. Arm also handles heterogeneous cores with a PMU instance per core type, a problem server-class x86 never has to solve and, as the big.LITTLE breakage described later shows, one Arm didn’t solve cleanly at first either.
Which events exist isn’t fixed. The kernel shows or hides events based on the PMCEID0 and PMCEID1 registers, which report what the silicon in front of you actually implements, so perf list hw genuinely differs between N1, V1, N2, V2 and V3. Check it on the machine. The kernel header is not the authority; the hardware is.
Neoverse event coverage across generations
| Core | Architecture | Events | What it adds |
|---|---|---|---|
| Neoverse N1 (Graviton2) | Armv8.2-A | 13 event files | Cache, TLB, branch, stall. No SVE. |
| Neoverse V1 (Graviton3) | Armv8.4-A | SVE events added | 256-bit SVE vectors |
| Neoverse N2/V2 (Graviton4, Cobalt, Axion) | Armv9.0-A | ~155 common events | SVE and SVE2 events, full Topdown L1 |
| Neoverse V3 | Armv8.7-A+ | ~254 events | Frontend and backend drill-down, deeper pipeline instrumentation |
From N2/V2 onward you get the full top-down set, backend_bound, frontend_bound, retiring and bad_speculation, straight out of perf stat -M, plus predefined derived metrics: IPC, branch MPKI, cache MPKI at each level, TLB MPKI, and SVE utilisation. On paper that is everything you’d want. The rest of this post is largely about how much of it survives contact with a hypervisor.
SVE profiling: a surprising gap
Neoverse N2/V2 and later cores expose SVE (Scalable Vector Extension) events with no x86 equivalent: SVE_INST_SPEC, SVE_PRED_SPEC, SVE_PRED_EMPTY_SPEC, SVE_PRED_FULL_SPEC, SVE_PRED_PARTIAL_SPEC. Together they tell you whether SVE code is using the full vector width or burning cycles on masked-out elements, which is the difference between vectorised and vectorised well.
An Arm Learning Path profiling quantised LLM inference (TinyLlama 1.1B Q8_0) with llama.cpp on a Grace CPU, Neoverse V2, Armv9, measured SVE and SVE2 at 0.00%. The framework used NEON for 7–15% of instructions and scalar FP for 2–5%. The widest SIMD on the chip went untouched by one of the most widely deployed inference frameworks there is.
How SPE actually works
SPE is an optional extension introduced in Armv8.2. The mechanism is worth spelling out, because it explains why the skid described earlier isn’t merely reduced but absent.
After each operation is decoded, a sampling interval counter is decremented. When it reaches zero, with optional random perturbation so the sampling doesn’t lock onto a periodic pattern in the workload, that operation is tagged and tracked through the pipeline. Only one tagged operation is in flight at a time. When it completes, the hardware assembles a self-describing record: instruction virtual address, operation type, issue-to-completion latency, data virtual and physical address, which level of cache or memory served it, and the events it hit on the way (cache miss, TLB miss, branch mispredict). Records go to a memory-mapped buffer, and an interrupt fires only when the buffer fills.
That last part is the whole trick. The interrupt is decoupled from the sample, so nothing has to be inferred from where the program counter happened to be when it arrived. Academic work puts SPE at >94% accuracy at sampling periods of 3000–4000, for 0.2%–3.3% time overhead. That figure is cited rather than reproduced; everything I measured myself is labelled as such further down.
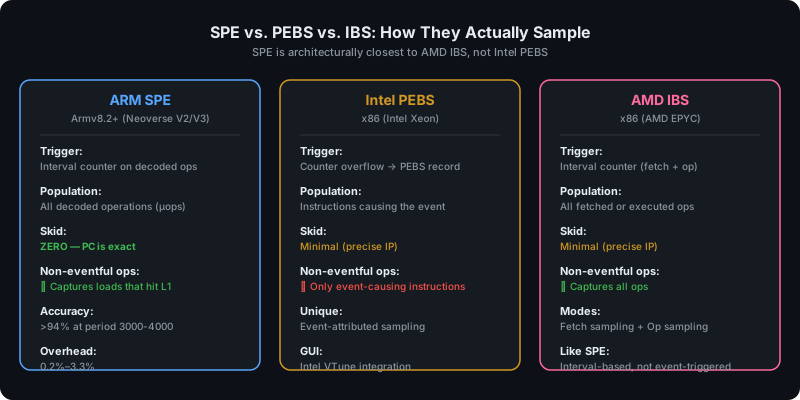
Figure 1. SPE samples operations at intervals the way AMD IBS does, rather than on a counter overflow the way Intel PEBS does.
SPE is not Arm’s PEBS, though that’s the comparison most people reach for. Intel PEBS is triggered by a specific counter overflow and then captures a record for the instruction that caused it. SPE picks operations at intervals and records whatever those operations turn out to experience, which is what AMD IBS does. The practical consequence is that SPE sees uneventful operations too, a load that hits L1 as readily as one that misses to DRAM, so you get the shape of the whole distribution instead of only its tail.
The kernel driver has rough edges. There’s no frequency-based sampling, so you specify a fixed period rather than a target rate. No exclude_idle. No guest support, which turns out to be a recurring theme. And below a period of roughly 2000, samples begin colliding: the next operation is selected before the previous one has completed, and records get dropped.
BRBE: Arm’s answer to Intel LBR, minus call stacks
The Branch Record Buffer Extension (BRBE) is Arm’s equivalent to x86’s Last Branch Record, an optional extension from Armv9.1. It records 8–64 branches in hardware with source address, target address and metadata.
The gap anyone coming from x86 will hit within a day is that PERF_SAMPLE_BRANCH_CALL_STACK isn’t supported, so perf record --call-graph lbr doesn’t work on aarch64 at all. You fall back to DWARF unwinding, which costs more, or frame-pointer unwinding, which needs the frame pointers to have been compiled in. BRBE also has no guest support and no transactional execution filtering.
The test matrix
I ran the same two synthetic workloads across four AWS instance types, escalating until things worked, and later repeated them on Google Axion.
I built the workloads so I could predict the outcome before measuring. memlat walks a 192 MB buffer two ways: sequentially with stride 64, which the prefetcher loves and which ends up bandwidth-bound, and as a random pointer chase, which defeats the prefetcher entirely and ends up latency-bound. Same buffer, same instruction count, only the access pattern differs. vecmix compiles identical source twice, once with -fno-tree-vectorize and once with -ftree-vectorize, so the only variable is whether the vectoriser fired.
If a profiler disagrees with a workload whose behaviour you already know, either you misunderstand the tool or the tool is lying. Predicting the answer first is how you find out which.
Here it is in full, because a claim about reproducibility isn’t worth much without the code. It compiles with cc -O2 -g -fno-omit-frame-pointer -o memlat memlat.c and runs as ./memlat chase 10 or ./memlat seq 10.
// memlat.c — two memory access patterns with opposite, predictable signatures.// seq: stride-64 sequential walk. Prefetcher keeps up. Bandwidth-bound.// chase: pointer chase through a random permutation of cache lines. Every load// depends on the previous load's result, so the prefetcher is useless and// each access waits on DRAM. Latency-bound.// Same buffer, same access count. Only the pattern differs.#define _GNU_SOURCE#include <stdio.h>#include <stdlib.h>#include <string.h>#include <stdint.h>#include <time.h>
#define LINE 64 // Arm cache line#define BUF_MB 192 // past Graviton4's 36 MB LLC
static double now(void) { struct timespec ts; clock_gettime(CLOCK_MONOTONIC, &ts); return ts.tv_sec + ts.tv_nsec / 1e9;}
// Fisher-Yates over line indices, then link each line to the next in that order,// producing one cycle so the chase never terminates early. Fixed seed = repeatable.static void build_chase(char *buf, size_t n) { size_t *ord = malloc(n * sizeof *ord); for (size_t i = 0; i < n; i++) ord[i] = i; srand(1234); for (size_t i = n - 1; i > 0; i--) { size_t j = (size_t)((double)rand() / ((double)RAND_MAX + 1) * (i + 1)); size_t t = ord[i]; ord[i] = ord[j]; ord[j] = t; } for (size_t i = 0; i < n; i++) *(char **)(buf + ord[i] * LINE) = buf + ord[(i + 1) % n] * LINE; free(ord);}
int main(int argc, char **argv) { const char *mode = argc > 1 ? argv[1] : "seq"; int secs = argc > 2 ? atoi(argv[2]) : 10; size_t bytes = (size_t)BUF_MB << 20, n = bytes / LINE;
char *buf = aligned_alloc(LINE, bytes); if (!buf) { perror("aligned_alloc"); return 1; } memset(buf, 1, bytes); // fault every page in first
uint64_t ops = 0; double t0, t1; if (!strcmp(mode, "chase")) { build_chase(buf, n); char *p = buf; t0 = now(); do { // the hot loop: subs / ldr / b.ne for (int i = 0; i < 1000000; i++) p = *(char **)p; ops += 1000000; t1 = now(); } while (t1 - t0 < secs); if (!p) printf("unreachable\n"); // stop the compiler eliding the chain } else { volatile uint64_t sink = 0; t0 = now(); do { for (size_t i = 0; i < n; i++) sink += buf[i * LINE]; ops += n; t1 = now(); } while (t1 - t0 < secs); }
double el = t1 - t0; printf("mode=%-6s buffer=%zuMB accesses=%llu %.1f M-access/s %.2f ns/access\n", mode, bytes >> 20, (unsigned long long)ops, ops / el / 1e6, el / ops * 1e9); free(buf); return 0;}Two details in there matter more than they look. The fixed srand(1234) seed means the permutation is identical between runs and between machines, so the comparison is genuinely like-for-like. And the if (!p) at the end exists only to stop the optimiser noticing that nothing consumes p and deleting the entire chase loop, which it will happily do otherwise.
One build note worth stealing. My first vectorised binary barely vectorised at all, because acc += a[i] is a loop-carried floating-point dependency, and GCC won’t reorder floating-point addition without -ffast-math since it isn’t associative. Both binaries needed -ffast-math so the only difference between them was -ftree-vectorize. Without that correction the experiment would have proved nothing while looking like it worked, which is the worst kind of broken.
The predictions held. Sequential came in at 2.41 ns/access, the pointer chase at 126 ns/access, a 52× gap from access pattern alone. Scalar hit 4.17 GFLOP/s against 9.65 for the vectorised build, a 2.31× speedup on Graviton4. On Graviton2, which has NEON but not SVE, the same comparison gave 1.72×.
The numbers behind the skid
The three VM-capable recipes work fine, and code_hotspots produces a genuinely useful profile. Like every interrupt-driven profiler it carries the skid described above, which is why the SPE comparison is worth making explicitly.
Here is the data I measured it on. I ran it three times before I believed it.
| Chip | Interrupt source | Samples on the branch | Samples on the load |
|---|---|---|---|
| Graviton2 VM (Neoverse N1) | PMU overflow | 98.0% of 15,467 | 0 |
| Graviton4 VM (Neoverse V2) | PMU overflow, 10× rate | 94.9% of 161,031 | 24 (0.015%) |
| Google Axion C4A VM (Neoverse V2) | software timer | 77.8% of 8,275 | 0.02% |
| Graviton4 bare metal | PMU overflow, perf record -F 999 | 8,077 | 3 |
| Graviton4 bare metal, via SPE | hardware sample record | 0 | 138 |
The last two rows are the controlled pair, and they’re the ones the opening of this post quotes: same machine, same binary, same workload, differing only in sampling mechanism. Everything above them establishes that the effect isn’t specific to one core generation, one sampling rate, or one hypervisor.
Ten times the samples on a newer chip moved the needle from 0 to 24 out of 161,031. That is not a measurement you can fix by collecting harder.
The third row is the one that closes off the obvious objection. Google Cloud’s C4A instances hide the PMU from guests entirely, so perf has no hardware counter to overflow and falls back to a plain software timer (cpu-clock). Skid persists anyway. The stalling load still collects 0.02% while the free branch takes 77.8%.
That rules out the explanation you’d reach for first, which is that skid is an artifact of how PMU overflow interrupts get delivered. It isn’t. Any interrupt-driven sampling has it, because the handler always reads the program counter some instructions after whatever triggered it. The one thing that changed was the landing spot: on Axion the subs between the load and the branch picked up 19.4% of samples, where on Graviton with a hardware PMU it got essentially none. Software timer interrupts have a shorter skid distance. Same direction, different distance.
SPE also reports why each sample was slow, which an interrupt fundamentally cannot: the interrupt only knows where the program counter landed, whereas the hardware record knows what the operation was doing. From a single capture:
49,691 memory / l1d-access / tlb-access 3,163 l1d-miss 2,382 llc-access 984 tlb-miss 433 llc-missInterrupt sampling returns a program counter. SPE returns a program counter plus what happened at that instruction.
I nearly published a glib version of this comparison, so here’s the caveat. SPE’s load filter samples per operation. Interrupt sampling samples per unit of time. When I first looked at the SPE output, most of the samples were sitting in my setup code rather than the hot loop, and I assumed the capture had been truncated. It hadn’t: the timestamps spanned the full eight seconds with zero lost samples. The two methods are answering different questions. Interrupt sampling asks where the time went. SPE load sampling asks which loads ran and what each one cost. Lining them up side by side as if they measure the same thing is a mistake I made for about twenty minutes.
SPE is a bare-metal feature on AWS, and this one is documented rather than inferred. The Graviton runbook says plainly that “SPE is enabled on Graviton 2, 3, 4, and 5 metal instances”, and it’s why AWS’s own open-source profiler, APerf, gates its microarchitectural “Hotline” feature to bare-metal Graviton.
The same test on Google Axion
Having established the counter picture on AWS, I ran the identical workload on Google Cloud’s C4A
Axion instances. Same core generation as Graviton4: MIDR 0x410fd4f1 on both, which Performix
reads and reports, so this is genuinely the same microarchitecture behind two different hypervisors.
| AWS Graviton VM | Google Axion C4A VM | |
|---|---|---|
armv8_pmuv3_0 device | present | absent |
| Programmable counters | 2 | 0 |
cycles event | works | <not supported> |
What perf record selects | cycles (hardware) | cpu-clock (software timer) |
perf_event_paranoid default | 1 | 3, blocks even software events |
memlat chase | 126 ns/access | 103.6 ns/access |
memlat seq | 2.41 ns/access | 2.53 ns/access |
Google’s hypervisor is meaningfully more restrictive than AWS’s. It doesn’t expose a reduced
PMU; it exposes no PMU at all. There is no armv8_pmuv3_0 device to open, and the default
perf_event_paranoid of 3 blocks even software events until you lower it.
Two consequences. The first is the useful one: forcing perf onto a software timer produced the
cleaner skid proof described above, which AWS couldn’t give me because AWS always had a hardware
counter available. The second is that Axion is slightly quicker on both access patterns, though
I’d want more than one run before reading much into an 18% gap on a latency-bound loop.
What each hyperscaler actually exposes
AWS Graviton: the most complete story
AWS has the most complete Arm profiling ecosystem of any cloud provider, and it isn’t close. The Graviton Performance Runbook is a maintained GitHub repository laying out a top-down debugging methodology with checklists, helper scripts for collecting counter ratios, and event lists with threshold guidance. It’s the document I kept going back to, and most of the corrections in this post came from it.
AWS also built and open-sourced APerf, a CLI tool that collects CPU usage, interrupts, memory, I/O, network and PMU counters as a single time series and renders an interactive HTML report. It runs on Graviton, Intel and AMD, so you can profile both sides of a migration with it, at a target overhead under 5% of one CPU. One AWS case study took a Graviton3 Java benchmark from 50% below the x86 reference to 36% above it.
Metal instances additionally expose the Coherent Mesh Network PMU for interconnect events, alongside the SPE access discussed above. Neither is available on a virtualised instance. Which sizes get which counters is the single biggest practical constraint on the whole stack, and the counter wall below is what it looks like when you run into it.
Azure Cobalt 100: the thinnest story
Azure Cobalt 100 (Neoverse N2, GA 2024) has no vendor-specific profiling tooling at all. Microsoft documents VM sizes and deployment, and stops there: no profiling guidance, no PMU event documentation, no debugging methodology. You’re left with generic perf, where the counters are usually unavailable anyway, Arm’s Learning Paths, or something third-party like Dynatrace.
There’s a good illustration of what first-generation custom silicon costs you. In February 2024 a Microsoft engineer submitted a kernel patch to override Cobalt 100’s MIDR_EL1 with the standard Neoverse N2 value, because Cobalt reports Microsoft’s implementer ID (0x6D0) rather than Arm’s (0x41), and workload optimisations and errata workarounds keyed on the implementer were silently not firing. The measured cost was a 20–25% regression. Kernel maintainers rejected the patch and said the software projects should learn Microsoft’s ID instead, which is the principled answer and also the slower one.
Google Axion: solid silicon, no first-party tooling
Axion uses Neoverse V2 in C4A and Neoverse N3 in N4A, and the silicon is fine, as the measurements earlier in this post show. Google offers vPMU in Architectural and Standard tiers but restricts the Enhanced tier to x86 instance types. There’s no Axion-specific profiling tool, only the architecture-agnostic Cloud Profiler and whatever perf will give you, which on C4A is not much.
Ampere: the most structured suite
Ampere open-sourced four tools under the Ampere Performance Toolkit: a System Profiler for system-level monitoring, a PMU Profiler for microarchitectural analysis built on perf with top-down and sunburst views, a Porting Advisor that scans for x86-to-aarch64 incompatibilities, and a benchmarking kit that includes AI inference workloads. For a company Ampere’s size, that’s a serious commitment.
Comparative summary
| Platform | Arm CPU | PMU access | Dedicated tool | Developer experience |
|---|---|---|---|---|
| AWS Graviton | Neoverse V2 | Yes, tiered by size | APerf (open source) | Best |
| Oracle/Ampere | N1, AmpereOne | Yes, via perf | APT suite, 4 open-source tools | Good |
| GCP Axion | V2 (C4A), N3 (N4A) | vPMU, no Enhanced tier | None | Moderate |
| Azure Cobalt | Neoverse N2 | Limited | None | Worst |
The counter wall
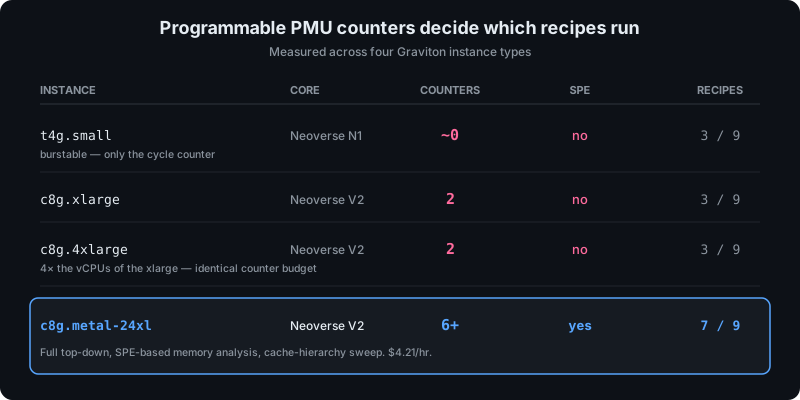
Figure 2. Resizing from 4 vCPUs to 16 did not change the counter budget. Only a dedicated socket does.
Performix needs three or more programmable PMU counters for its most valuable recipes. Its error is refreshingly specific:
The specified recipe requires 3 or more PMU counters to collect thenecessary profiling metrics. CPU 0 on the target has only 2. tool_integrations.neoprof.INSUFFICIENT_PMU_COUNTERSA virtualised Graviton instance gives you two. I assumed a bigger instance would help, so I resized from c8g.xlarge (4 vCPU) to c8g.4xlarge (16 vCPU). Still two. That cost me an hour and about four dollars to learn, and I should have saved myself the trouble, because AWS documents the answer in a table I hadn’t found yet: for the *8g family, full PMU event support starts at 24xlarge. A 16-vCPU instance was never going to be enough.
One thing confused me for a while. perf stat will happily run three events with no multiplexing, which certainly looks like three counters. It isn’t. Armv8 PMUv3 gives you a dedicated cycle counter plus N programmable ones, so three events fit as one fixed plus two programmable. Add a fourth and multiplexing kicks in immediately, visible as the (50.11%) and (33.06%) annotations in the output. Performix counts programmable counters, correctly, and reports two.
On a normal cloud VM that leaves you three of nine recipes: code_hotspots, system_utilization, and syscall_trace_summary. The last one works only because it uses strace and needs no PMU at all.
Worth being precise about what this is, and about which part of it is documented versus which part I measured. It’s a constraint imposed by the platform, not by Performix. AWS’s own Graviton performance runbook states it directly:
“Not all instance sizes support PMU event collection. Generally instance sizes which have an entire dedicated socket have full access to all PMU events, and smaller instance sizes of the newer generations have a reduced set of events suitable for most profiling needs.”
The same page carries a per-family table of which sizes get full support. For *8g it’s 24xlarge and 48xlarge; for *7g, 16xlarge. Everything smaller gets what AWS calls “basic support”.
The constraint isn’t AWS-specific, and AWS is in fact the most generous of the three. Azure Cobalt VMs commonly return <not supported> from perf stat outright, GCP restricts its Enhanced vPMU tier (L3 and uncore events) to x86 instance types, and KVM on aarch64 doesn’t expose PMMIR_EL1.SLOTS to guests at all, which disables topdown metrics inside any KVM guest regardless of who runs it.
Two things are worth separating here. AWS is describing a reduced set of events, meaning which things you can count. The number of programmable counters, meaning how many you can count simultaneously, is a related but distinct limit, and the figure of two is mine: measured with perf stat and independently confirmed by Performix’s error message. I haven’t found AWS documenting the counter count explicitly, so treat that number as an observation rather than a specification.
Any tool wanting three or more counters hits the same wall, and Performix reports it clearly rather than silently producing degraded numbers.
It does shape how you plan a profiling session, so it’s worth knowing the scale of it. I don’t know what proportion of Graviton capacity runs on bare metal versus virtualised instances, and as far as I can tell AWS has never published that. What I could measure is the shape of the catalogue:
arm64 instance types in us-west-2 | 381 |
| of which bare metal | 38 (10%) |
| smallest virtualised arm64 | 1 vCPU |
| smallest SPE-capable bare metal | 64 vCPU |
c8g.metal-24xl vs c8g.xlarge, per hour | 26× |
Ninety percent of the arm64 catalogue gives you two programmable counters. There is no small bare-metal Graviton: the options are 64, 96 or 192 vCPUs, and the one 16-vCPU exception is a1.metal, a first-generation Graviton that predates SPE entirely.
That doesn’t prove what people actually run, and it isn’t the same claim. What it does mean in practice is that the deepest analysis is a scheduled activity rather than a casual one: you characterise on bare metal, then carry what you learned back to the instance size you deploy on. Given that bare metal bills by the second, two hours of it cost me less than a team lunch, so this is a planning consideration rather than a real barrier.
What Performix is
Performix is a host/target profiler. A desktop app runs on your machine, connects over SSH to an aarch64 Linux target, and pushes a lightweight agent there on demand. Analysis is recipe-based: you pick a named analysis, point it at a workload, and it handles collection.
The run log exposes a clean 13-stage pipeline. Connect, identify architecture, check platform support, reconcile tool deployment, connect to agent, acquire an exclusive target lock, collect, release, retrieve artifacts. Collection happens on the target and analysis happens on the host, and apx run export produces a zip you can hand to someone else and re-import.
That separation matters more than it sounds. In a regulated environment where you’ll never get SSH into production, a customer can record and hand you the artifact instead.
Under the hood it’s built on Streamline, Arm’s long-standing analyser. You can see it in the shipped binaries: sl-collect, sl-analyze, libstreamline-capi-core, and a gator-log.txt in every run directory. Gator is Streamline’s capture daemon. Performix is a new front end and a new analysis layer sitting on a mature capture engine.
The CLI reports nine recipes on disk, though recipe list only shows seven on any machine I tested:
| Recipe | What it does |
|---|---|
code_hotspots | Where time goes: flame graphs, function tables, call stacks |
memory_access | SPE-based load analysis: latency, cache level, alignment |
instruction_mix | Breakdown of instruction types |
cpu_microarchitecture | Top-down analysis with per-target metric groups |
asct | System characterization: cache hierarchy, bandwidth, NUMA |
syscall_trace_summary | Syscall activity via strace, output as Parquet |
system_utilization | OS-level timeline, no PMU required |
cmn_analysis | Coherent Mesh Network (interconnect), never appeared |
cache_sharing | False-sharing detection, never appeared |
Recipes are JavaScript modules against a documented API, not config files. Each one exports a recipe object with deployment targets, architecture and OS predicates, and version-pinned tool dependencies. You can write your own, which is more than most profilers offer.
What bare metal actually buys
Two hours on a 96-core Graviton4 metal instance cost $9.25 and answered everything the VMs couldn’t.
The flagship is memory_access, which is SPE-native. It produces roughly 140 columns per function: latency histograms bucketed from 0 to 4096+ cycles for issue, execution and translation latency, branch MPKI and mispredict breakdown, operation mix including SVE and SME, TLB walk cost, load and store alignment. The column I’d actually pay for is load-source attribution, with both cost and count, across L1C, L2C, Peer, Local Cluster, LLC, Peer Cluster, Remote and DRAM.
Knowing a load is slow is easy. Knowing it was served from a peer core’s cache rather than local L2 is what tells you whether to fix your data layout or your thread pinning, and I don’t know another way to get that on Arm without writing the SPE decoding yourself.
asct maps the memory hierarchy with a latency sweep, and it independently corroborated my synthetic benchmark.
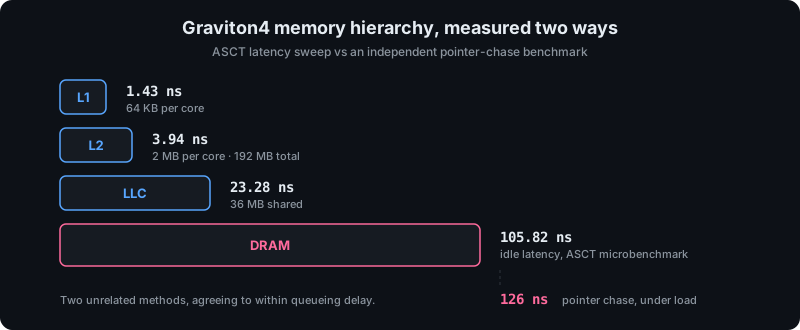
Figure 3. ASCT’s microbenchmark and my pointer chase are unrelated methods. Agreeing to within the queueing delay you’d expect under load is what makes either number defensible.
Field notes from six instances
A few things I ran into that are worth knowing before you start, and that I’d raise with the team if I were on it.
The one that surprised me most is instruction_mix, which answers a narrower question than its name suggests. My scalar and vectorised binaries produced near-identical output: 109,181 versus 109,183 load instructions, 3,554 versus 3,559 SIMD. I spent a while assuming I’d broken the build before I read the log:
Disassembling 4 image(s) using resolver 'implicit-transitive' - vecmix_neon Found 284 instructions in static binary - /usr/lib64/libm.so.6 Found 74,078 instructions - /usr/lib64/libc.so.6 Found 289,582 instructions - ld-linux-aarch64.so.1 Found 31,046 instructionsIt’s a static, whole-image count that includes every linked library. The program under test is 284 of 394,990 instructions, or 0.07% of what’s being counted. The hot loop’s handful of NEON instructions is statistically invisible against libc.
That matters because “did my hot loop actually vectorise?” is a question both AWS and Arm clearly expect people to be asking. AWS’s Graviton guide gives it a dedicated page plus another on runtime feature detection, and Arm’s own AI Insights prompt, quoted further down, instructs the model to check for exactly this failure. objdump confirmed the two binaries really do differ, with zero vector FP ops in one and several plus 128-bit q-register loads in the other. The difference is there. The recipe just doesn’t surface it. Scoping to the hot function, or offering a dynamic mode weighted by samples, would fix it.
Two recipes stayed hidden on every target I tried, including bare metal, and in the cmn_analysis case the fault was entirely mine. /sys/bus/event_source/devices/arm_cmn* was absent on c8g.metal-24xl, which I initially took to mean AWS doesn’t expose the interconnect PMU there. It does. AWS’s runbook has a compatibility table showing CMN support by distro and kernel, and for Graviton4 on Amazon Linux 2023 you need kernel 6.12 or newer. I was on the AL2023 default, 6.1.176, which the table lists as unsupported for c8g. A newer kernel would very likely have given me the recipe. The tool was correctly gating on a capability my machine genuinely didn’t have, and the fix was a kernel upgrade I didn’t know to make. cache_sharing I never worked out, and it may well be something in my setup rather than the tool.
The one I’d actually file as a bug turned up on Google Axion, and it’s worth describing precisely because the fix looks small.
On AWS with two programmable counters, cpu_microarchitecture fails immediately and helpfully,
with the INSUFFICIENT_PMU_COUNTERS error quoted earlier. That’s exactly right. On Google Axion,
with zero counters, the same recipe reports success.
You get a run ID, no error, and artifacts on disk. Then you look at them:
| Artifact | Data rows |
|---|---|
functions-capture-metrics.csv | 0: header only, 2,818 bytes of column names |
callpaths-capture-metrics.csv | 0 |
callpath_self_metrics.json | 0 |
callpath_total_metrics.json | 0 |
The same recipe on AWS bare metal produced 23 populated rows in that first file. The header
promises General: Instructions Per Cycle, Cycle Accounting: Frontend Stalled Cycles,
Topdown Level 1: Frontend Bound, L1 Instruction Cache Effectiveness: L1I Cache MPKI. Every
column is empty.
I’d flag this as the highest-value thing I found, because silent degradation is the one behaviour a measurement tool can’t afford. Someone running only this recipe on GCP gets a green result and no data, with nothing indicating why.
The encouraging part is that the fix already exists elsewhere in the product. memory_access on
that exact same target fails cleanly with SPE_NOT_CONFIGURED and tells you what to do about it.
So the capability-gating logic is written and works; cpu_microarchitecture just isn’t wired into
it for the zero-counter case. Extending the check it already applies at 1–2 counters down to 0
would turn a confusing non-result into the same clear message AWS users already get.
Then some smaller things. Recipes initially report “not ready, tool is not deployed on the target”, which I first read as a platform incompatibility when it just needed --deploy-tools. The target lock is exclusive with a three-second timeout, so it’s one analysis at a time per machine, which is sensible for measurement integrity but worth knowing if you’re scripting. And asct needs Python 3.10+, which Amazon Linux 2023 doesn’t ship by default.
The agentic layer is the most interesting part
Everything above describes a competent profiler. This next part is the bit I didn’t expect.
apx mcp start runs an MCP server exposing seven tools to an AI agent: list_targets, add_target, list_recipes, list_runs, run_recipe, generate_ai_insights, read_ai_insights_payload_details. An agent can add a target, pick an analysis, profile a workload and pull back structured evidence without a human touching a GUI. It plugs into Copilot, Codex, Gemini, anything speaking MCP.
generate_ai_insights builds an evidence bundle: five payloads, about 15 KB, shaped for a model to consume.
| Payload | Contents |
|---|---|
run_details | Workload, OS, kernel, sampling params, CPU topology including the Arm MIDR_EL1 register |
hot_functions | Self samples with percentages, to 99% cumulative |
call_tree | Hot paths, depth-first, siblings by descending samples |
disassembly_windows | Actual disassembly around every sampled instruction |
source_windows | Source text around the hottest lines |
Sampling data, disassembly, source and machine spec in one package. It currently supports code_hotspots only, which happens to also be the recipe that runs on a normal VM. Convenient, and probably not a coincidence.
The part that made me stop and read twice is that the bundle ships Arm’s own analysis prompt. It’s a guidance document telling the model how to read an Arm profile, and two lines in it are the whole migration story:
“If the hotspot already uses SIMD instructions, do not assume the implementation is fully optimized. Distinguish fixed-width SIMD from wider or scalable-vector-capable targets.”
“If a significant hotspot has an explicit architecture-specific optimized implementation for some targets, but the current target appears to be using a less optimized fallback path, treat that as strong evidence for recommending an equivalent target-specific implementation.”
That’s NEON versus SVE, and the library-quietly-fell-back-to-generic-code failure mode. The two things that actually go wrong when x86 workloads move to Arm, written down as instructions to a model.
It’s also written carefully against the ways models fail. “Do not assume that every hotspot implies a problem.” “A correct assessment may conclude that no immediate change is warranted.” “Prefer percentages to raw sample counts.” “Avoid speculative low-level tuning suggestions.” Somebody clearly thought about the obvious risk here, which is a confident model recommending a loop transformation that makes things worse.
The profiler is the easy half. Anyone can sample a PMU; the kernel does the hard part. Knowing which Arm-specific failure modes to look for, and stopping a model from inventing optimisation work, is the part that took institutional knowledge to write down.
For CPU-side AI and agentic workloads I think this fits well, though I should be clear that’s a judgement rather than something I measured. Inference orchestration, tokeniser and data-loader paths, embedding lookups, request routing, KV-cache management: the CPU work around an accelerator is a plausible place for latency to hide, and it’s the kind of code written by people whose expertise is in models rather than in Arm microarchitecture. I’d want to see it used in anger on a real inference stack before claiming more than that. Handing a model the disassembly, the source and the cache-miss attribution, along with instructions on how to read them, at least lowers the barrier to looking.
How this relates to AWS APerf
Anyone who has profiled on Graviton will be wondering how this compares to APerf, AWS’s own open-source performance tool, so it’s worth addressing directly.
APerf came first. Its first public release was October 2022, and its SPE-based “Hotline” analysis landed in July 2025, nine months before Performix was announced. It’s still actively developed.
I don’t read that as Arm playing catch-up, and the reason is what APerf’s own README says about why it exists:
“performance issues in applications are investigated by… collecting data/metrics using monitoring tools like sysstat, perf, sysctl, ebpf, etc… Installing and executing various performance monitoring tools is a manual process and prone to errors. Even after collecting data, understanding the output of these tools requires deep domain specific knowledge.”
That’s the same diagnosis Performix is built on, reached independently by a different organisation years earlier. Two engineering teams with no reason to coordinate looked at Arm performance work and identified the same two problems: fragmentation, and the expertise required to interpret raw counters. When that happens, it’s good evidence the problem is real rather than invented to justify a product.
The two tools also inherit identical platform constraints, which was reassuring to confirm. APerf states plainly that “Hotline can only be built and run on a baremetal Graviton instance”, uses the same arm_spe_pmu module and the same perf_event_paranoid setting. The counter wall I hit isn’t a Performix limitation. AWS’s own team hit it and documented it in the same terms.
Where they differ is scope and mandate, and that’s where Performix earns its place.
APerf is a hyperscaler solving its own problem for its own silicon. It’s excellent at that. Its multi-run diffing, where you nominate a base run and everything else is compared against it with statistical findings, is the single best migration feature in either tool, and I’d use it for exactly that. It also runs on x86, so you can profile both sides of a migration with one tool, and it ships as a single static binary with no host application.
Performix is the architecture owner solving it for everyone building on Arm. The same methodology and the same metric definitions apply on Graviton, Cobalt, Axion and Arm’s own AGI CPU. If your comparison spans clouds, or you want a characterisation that means the same thing on somebody else’s Neoverse silicon, that portability is the whole point.
The clearest illustration of the difference is SPE itself. APerf’s Hotline is not distributed as a binary: you have to build it from source on a metal instance with cargo build --release --features hotline, after manually loading the kernel module. Performix’s memory_access is a recipe you run. Same hardware feature, same underlying data, and Performix has done the work of making it something you can reach for rather than something you compile. Getting SPE from “possible” to “one command” is genuine engineering, and it’s the thing I’d point at if someone asked what Arm added.
The MCP server and the AI Insights bundle have no equivalent in APerf at all.
My honest summary is that they’re complementary rather than competing. Performix is the better Arm-native analysis tool. APerf is the better AWS-specific migration-comparison tool. On Graviton I’d keep both installed, and that’s not a hedge: they’re answering different questions.
The open-source ecosystem
eBPF: functional, with historical gaps
bpftrace has first-class aarch64 support: all 31 general-purpose registers mapped, arguments following AAPCS64. Pre-built Arm release binaries only arrived in June 2026, though. Before that you compiled it yourself, which is a small thing that tells you where Arm sat in the priority order.
The kernel’s arm64 feature status page for v6.19 still marks kprobes-on-ftrace and optprobes as TODO where x86_64 has both. A BPF co-maintainer put it plainly in September 2025, on bpf_get_stackid returning -EFAULT: “I suspect the arm64 implementation wasn’t really tested.”
The OpenTelemetry eBPF Profiler, donated by Polar Signals, is the most substantial new open-source entrant with real aarch64 support, covering 11 languages without needing frame pointers or DWARF. It has aarch64 bugs of its own: stack unwinding fails past the syscall boundary, and frame-pointer handling needed a fix in January 2026.
Continuous profiling
Parca Agent has had aarch64 DWARF unwinding since v0.25.0 in October 2023, including the ABI difference that catches people out, which is that aarch64 needs an lr_offset to work out return addresses from the link register. Grafana Pyroscope’s SDKs cover Linux aarch64 across the major languages, with the Ruby SDK still missing a precompiled aarch64-linux-musl gem as of June 2026. That’s a packaging gap rather than a capability one, and most of this category is in decent shape.
Valgrind: mature but not bug-free
Valgrind 3.25.0 and later support aarch64 Linux with three documented gaps. The one worth knowing about is a thread-scaling failure: PyTorch inference took 53 minutes on an 8-core Jetson Orin AGX against 13 minutes on a 4-core Raspberry Pi 5, so the more powerful machine ran 4× slower under Valgrind. There’s also missing debug info, which means no file or function names in leak reports, and a floating-point rounding bug specific to arm64.
Feature maturity: x86 vs aarch64
| Capability | x86_64 | aarch64 | Gap |
|---|---|---|---|
| eBPF JIT | mature | ok | None (core) |
| kprobes-on-ftrace | ok | TODO | Active gap |
| optprobes | ok | TODO | Active gap |
| perf data-type profiling | available | under development | 1–2 year lag |
| perf c2c (false sharing) | HITM-based | peer-based | Accuracy gap |
| Continuous profiling | full | full | Minor packaging gaps |
| Flamegraph tooling | yes | yes (arch-agnostic) | None |

Figure 4. The left column is most of what anyone actually does with a profiler. The right column is where aarch64 still trails x86, and it’s a short list.
Profiling AI workloads on Arm
NVIDIA Nsight on Arm: supported, but CLI-only
NVIDIA Nsight Systems supports Arm SBSA targets, but the SBSA package is CLI-only. You capture on the Arm box and copy the result to an x86, Windows or macOS host to look at it. NVIDIA’s own guide for profiling LLM training on GH200 with nsys profile found the BF16 GEMM kernel taking 49.9% of GPU time, with pthread_cond_wait blocks pointing at CPU-GPU synchronisation delay.
GPU profiling on an Arm host differs from x86 in three ways that matter: no GUI on SBSA, a different CPU sampling backend since there’s no LBR and you’re back on frame pointers or DWARF, and Grace-specific system PMUs (nvidia_scf_pmu, nvidia_nvlink_c2c0_pmu, nvidia_pcie_pmu) for CPU-to-GPU traffic.
The Grace Performance Tuning Guide warns that
stall_slot_backendandstall_slot_frontend“cannot be used to accurately measure backend and frontend boundness on Grace” (errata 2446525). Standard Arm Topdown L1 is inaccurate on Grace, and no tooling can fix it, because it’s a hardware errata. If you profile Grace and trust the topdown numbers, you are being lied to by the silicon.
PyTorch, vLLM, TGI and Triton
The PyTorch Profiler still has aarch64 gaps. PR #180005 from April 2026, “[Arm] Upgrade kineto to fix aarch64 platforms missing events”, is exactly what it sounds like. Arm maintains its own pytorch-aarch64 build, which is an admission about the upstream one.
vLLM took roughly a year to go from no Arm support to distributed wheels in August 2025, and has no built-in profiling instrumentation, so you profile it from outside. Hugging Face TGI never officially supported aarch64 and is now in maintenance mode, with the maintainers pointing people at vLLM or SGLang. NVIDIA Triton has supported Arm SBSA since 22.06, but the client wheels aren’t on PyPI for SBSA and pip will cheerfully install a Jetson build instead.
What’s genuinely broken
In February 2026, perf stat sleep 1 crashed on arm64 with an assertion failure. The cause was a sorting function that interleaved events from different groups, which only manifests on arm64 because of how Arm PMU event groups are structured. A generic perf change had been tested on x86 and shipped.
Worse, and more revealing: perf was broken on every big.LITTLE system for nine months. Hector Martin of Asahi Linux reported in November 2023 that perf had been broken on all Apple Arm systems since kernel v6.5, with perf stat returning <not counted> for everything on the LITTLE cores. When events did appear to work, the output all came from the firestorm PMU no matter which event you asked for, which is the worst failure mode available: plausible numbers from the wrong core. The heterogeneous-PMU problem is Arm’s alone, because x86 servers don’t have it.
Then there’s the absence of a VTune equivalent, which the .NET runtime team put on the record: “We evaluated MAP and Streamline tools from Arm Holdings. However, both of them are not working for .NET for the most basic CPU profiling.” They asked Arm to “Provide vTune like profiling tool that works for .NET performance analysis.”
The pattern connecting these is that most aarch64 profiling work is repair or catch-up rather than new capability. Even the naming gives it away: Arm’s metrics are called “topdown-like”, which is a hedge conceding the methodology doesn’t quite match the x86 one it’s named after.
Verdict
The consolidation pitch is real, and it’s implemented as adapters: linux_perf, wperf, asct, syscall-trace, jitdump, all sitting behind one recipe layer. You stop needing to know which tool answers which question.
The SPE-based memory_access output is the best cache-attribution data I’ve seen packaged this accessibly. Load-source breakdown with cost and count across L1C, L2C, Peer, Local Cluster, LLC, Peer Cluster, Remote and DRAM, plus latency histograms, is the kind of thing that used to mean writing your own decoder. ASCT’s hierarchy sweep is a genuinely useful bring-up tool, and it agreed with an independent benchmark to within the queueing delay I’d expect. JIT symbolication for JVM and .NET already ships, which is more than a lot of profilers manage. The capture and analysis split makes offline work practical, which matters for anyone who can’t get SSH into production. And the MCP integration, with an evidence bundle and an analysis prompt built around real Arm failure modes, is ahead of anything else I’m aware of in this space.
Four suggestions, offered as a user rather than a critic:
- Gate
cpu_microarchitectureat zero counters the way it already gates at one or two. This is the empty-table case above, and it’s the only thing I’d call a defect rather than a limitation. The check exists and works inmemory_access; extending it would turn a silent non-result into the clear error AWS users already get. - Report target capability up front, and say what would fix it. A line at connection time reading “this target exposes 2 programmable counters; these three recipes are available, these six need a larger instance or bare metal” would save a lot of trial and error. Better still, where the blocker is a kernel version rather than the hardware, say so. I lost a recipe to an AL2023 kernel that was two point releases too old and had no way of knowing from the tool.
- A dynamic, sample-weighted instruction mix scoped to hot functions. The static whole-image view is useful for what it is, but a sample-weighted view of the hot path would answer the vectorisation question directly, and that’s the question people arrive with.
- Extend AI Insights beyond
code_hotspots. The SPE data frommemory_accessis the richest thing the toolkit produces, and it’s the obvious next candidate for the evidence bundle.
Six instances across two clouds, five instance types, two hours of bare metal, about $9.55 all in. For a free tool on hardware you can rent by the second, that’s a cheap way to find out what your workload is actually doing on Arm, and the SPE comparison alone was worth the afternoon.
References
Arm Performix
- Product page and downloads
- Install guide: direct download URLs for macOS, Linux and Windows, plus the
apxCLI paths - User guide
- Launch announcement
- Find code hotspots with Arm Performix: a worked tutorial, and the fastest way to see whether it fits your workflow
Statistical Profiling Extension
- Arm SPE: SoC telemetry and performance analysis: Arm’s own explainer, the clearest one available
- Sampling instructions with SPE: hands-on, including what the sample records contain
- SPE PMU kernel bindings, if you need to check whether your platform exposes it
Top-down methodology and PMU counters
- Arm CPU Telemetry Solution: topdown methodology specification, the definitive reference for the two-stage method
- Neoverse V1 core telemetry specification, per-core PMU events and derived metrics; equivalents exist for N1, N2, N3 and V2
- Comparing Arm and x86 top-down analysis, genuinely the best starting point if you know Intel’s VTune model and want to map it across
AWS Graviton
- aws/aperf: AWS’s own open-source profiler for Graviton, and the closest thing to a direct comparison
- aws-graviton-getting-started: the performance runbook, PMU counter availability by instance size, and the documented migration pitfalls
- Graviton performance runbook